I have been managing projects in one way or another for 20 years, but have only found my best methodologies in the last 5 to 7. I’ve used Excel sheets, Trello, Asana, Jira, Confluence, MS Project, Azure, MS Teams and even Sharepoint and email to run and track projects. While you can make any tool work, having the right tools and protocols in place makes a huge difference and is key to enabling smoother and less stressful projects for everyone.
In my experience, common frustrations experienced with project governance are:
- heavy admin burden on the project manager
- progress reports not matching reality
- stakeholders in the dark on project status, plans or scope
- project team members not fully owning tasks assigned to them
- risks and issues not known by the people who need to know about them
- lack of records of decisions taken and changes made
- project records hard to find after project is completed

I believe that the methods I use now address all these problems. How well they address them (or not) comes down to how well I stick to these methods and how well I communicate and share them. Which is to say… it can vary!
Here is what I do.
Guiding principles
- Run projects lean. Document what is needed, keep plans light and nimble, keep detail out until needed
- Document for information sharing and for audit records
- Document consistently across projects
- Plan in blocks, high-level first and let the team add the detail together
- Slice projects as small as possible; for example, instead of one big project that encompasses multiple inter-dependent components, break these into separate projects wherever possible
- Only use real deadlines, and as few as possible (for example, avoid imposing “milestone” dates for completion of phases, but do track for actual items required on actual dates)
- Respect the work – both the work the team needs to do and how long it will take, and the work and time required to track and document the project
- Use software, not spreadsheets
Benefits of lean projects that use software tools:
- reduce admin effort around project management;
- reduce the frustration and wasted time that comes from “planning” and updating plans for things you cannot actually control;
- maximise team collaboration on the work;
- keep project information transparent and accessible; and
- make status and project reporting easy
Tools and practices
1. A web app documentation tool
Use an online application that can do searchable, nested documentation. For example, I have a header page per project, with linked pages underneath to manage analysis info, requirements, risks, issues, decisions, meeting notes, links to technical documentation, etc. This makes project information easily shareable and discoverable by others, and allows people to self-serve to find the information they need, instead of always asking the project manager. Especially once you set up some protocols, so that information is consistently structured across all your projects.
The best tool for this in my experience is Confluence, but there are others. If your company doesn’t use one, I recommend recommending it! Otherwise, do your best with shared documentation that follows a consistent format with well-named files and a good folder structure.

The best tools provide templates and labels that help you easily create professional and beautiful pages that are consistent, searchable and meaningful. Of course, you will still need to work out your protocols so that the project team documents their projects consistently, but this can be as simple as a one-pager that sets out for the team (and anyone else interested) how projects are documented. It is also useful to set up shell pages for a new project as pages to be completed. For example, when a project is set up, you could set up:
- Project home page with Project name, Objectives, Team, Target Date, Status, related projects (as links to those project pages) and linked pages (the pages below).
- Discovery
- Requirements
- Risks
- Issues
- Decisions
- Project closure
For small projects, you could combine some of the above into 2 or 3 pages instead of separate ones. Big projects may require multiple pages for Discovery or Requirements or other items, in which case these shell pages become header pages that group the information together.
Additional tips for easy to read, useful content:
- add a linked pages macro (or “children display” in Confluence terms) to every header page – that way linked pages are visible and accessible from the header page
- add a Table of Contents to every page. Where possible, make it “flat” rather than “list” and limit the “descendants” included, so your Contents doesn’t take up too much room on the page
- use headings in your text rather than making text large or bold; that way headings are picked up in the Contents
- break up text under sub headings or at least into short paragraphs
- use tables, bullets and other visual styles rather than just text, so that key information is consumable at a glance.
- use templates to easily create consistent pages, and remove any sections you don’t need
- lock or limit editing for pages you absolutely need to control, but otherwise:
- let the whole team create and edit pages
2. Simple roadmap planner
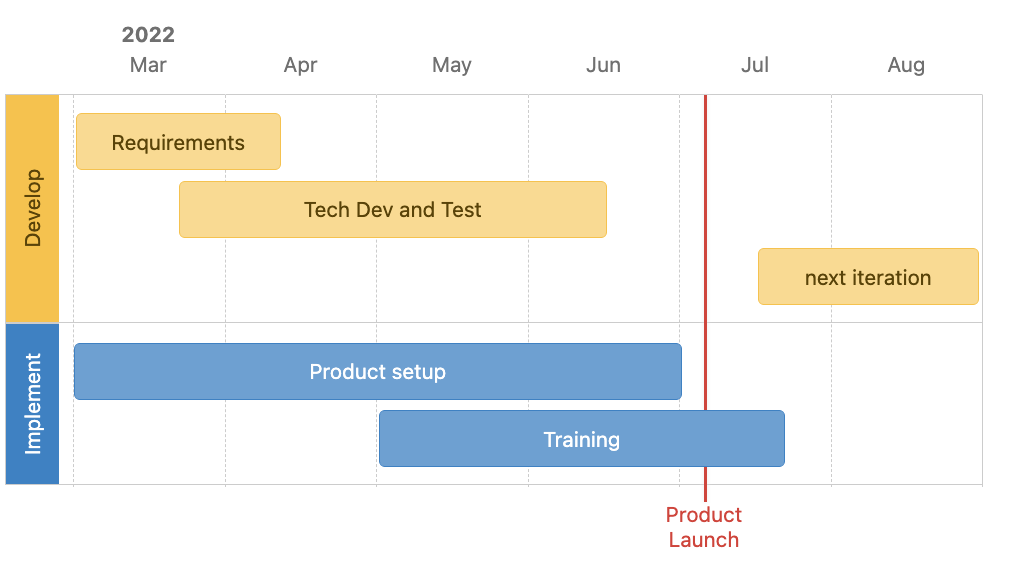
Not a Gantt chart, but a simple roadmap that outlines the target timeline for the various components of the project, is a helpful guide for anyone after a quick view, and is a nice visual that can be easily incorporated into reporting and presentations. There should not too many components, dates or deadlines in the roadmap; it represents the target and should not have to be updated constantly throughout the project. Use a simple tool like Powerpoint, Miro or Confluence to create the roadmap, so it is easy to update and you are not tempted to add too much to it.
Beware: if you create a roadmap in Excel, it WILL expand into a full Gantt sheet – don’t say you weren’t warned!
3. Project board
The biggest benefit I got as a project manager was switching from spreadsheets to software for managing project work and tasks. Having the work represented as cards on a board, and each card assigned to a team member, where that team member can add details, links, attachments and progress notes to that card, is a massive game-changer. Once teams get used to working on boards, they love it. Each card represents work that one or more people have taken responsibility for and managed to completion. The cards are visible to everyone, and can contain as much or as little information as needed. Everyone is different and you will find that some team members go to town on their cards and create a virtual book of information and data; others stick to one or two sentences from “to do” to “done”. This may take getting used to, but as long as you have the info you need for stakeholders, this variation does not matter. I enjoy the detailed cards and appreciate the info provided – it is in fact very useful and I will often link to these cards from my documentation pages to add context. But I also respect the fact that everyone works differently and as long as the work is done and the key items are documented, we’re in good shape.
The simplest structure for a project board is a Kanban board with columns representing the phases that tasks work through, from To Do to Done. You could just use To Do, Doing and Done, but for most projects that’s not helpful as you will end up with everything in Doing which isn’t very useful. I tend to use:
- To do
- Analysis
- Development (including testing and rework. For non-technical tasks, this means “Doing”)
- Implementation (includes everything done to “embed” the new feature or process into business-as-usual)
- Closed (either completed or not required and not done)
In addition to the columns, you can use swimlanes to split the work across different components. These will differ per project, but might include for example:
- Communications
- Compliance and Legal
- Technical development
- Operations processes
- Client training
A useful aspect of most project boards is that they can also be visualised and exported as a spreadsheet, which is helpful when you need to provide audit records of work done, especially after project completion.
Benefits of a project board:
- status of work to do and in progress is available at a glance
- boards are configurable so you can set up the sections you need and also the fields you need in your cards
- team members take ownership of their tasks and have full view and control over them – something that can be harder when the PM is managing the tasks on a spreadsheet that gets updated and distributed once a week, at which point everyone suddenly remembers what they were supposed to be working on!
- easy to see where there is too much work assigned to one person, as a person might realistically only be able to work on one or two cards at once
- updates are easy, and are done by the whole team, not just the PM
4. Live progress views
My Confluence project home page is the bird’s eye view of the project. In this page I maintain project summary information such as Goal, Team and Target Date, plus a simple Project Status table of six boxes:
| Project Phase DEVELOPMENT | Project Status ON TRACK |
| Updates / Completed – Technical development started on feature X | Issues / Changes – Scope change: feature Y removed from MVP – Person A added to team |
| Decisions – Agreed: item A. Decision made: … – To decide: item B | What’s next – Training requirements |
I use colours and emojis in these status boxes: green for DEVELOPMENT and ON TRACK, yellow for statuses like AT RISK; a green tick emoji for decisions taken and a question mark emoji for decisions required.
Now for the somewhat bad news (but it’s not that bad, honest): there is no automated way that I have found to keep project statuses updated. No matter what plug-ins you are using and no matter how well your project board integrates to your documentation tool, I have found status reports always have to be manually maintained. That’s not for lack of effort and testing on my part either! I keep thinking the magic tool must be out there, but it’s really not. There are some “program” plug-ins that you can use with your project boards, but they all rely on your multiple boards and teams running their boards and maintaining their cards in the exact same way which I have not ever found to be realistic. Maybe one day!
But, if your status reporting is simple and consistent in a format like the one above, this can be a five-minute task done once a day or once a week or on the fly as things change.
5. Regular reporting
I know we all dream of self-serve reporting, where everyone just looks up the project pages and gets the information they need…. or is that just me? Either way, of course that is not going to happen. As much as we live and breathe our projects, executive teams and other stakeholders have a million other things going on, so the need for regular reporting continues. Plus, reporting is a good way to showcase your projects to a wider audience, publicise team successes, and shape the conversations you need to have, such as getting traction on decisions that need to be made.
The benefit of using all the tools above is that reporting should become easy. The goal is to get everything you need for your reporting from your live project tools, and not have to manually and laboriously create project status reporting slide decks every week or month. I mean, you might have to expend a bit of labour setting up the first one, but it’s mostly copy-paste from then on!

As far as possible, try to sell a report format that is simple and visual and looks the same as your project pages or apps. If you need to tweak it, try and tweak your source formats to match.
One thing I have done in the past which was helpful, was to create a kind of “scrum of scrums” program board which was a board representing all the projects, with columns for project phase (To Do, Analysis, Development, Implementation, Done) and a card for each project. This board, though manually maintained, was easy to keep updated and provided a quick visual for anyone who cared to check it, plus was easy to copy as a visual onto a slide deck for executive reporting. If the executive team wants more detail, you can provide a page per project with a copy of your status boxes at item 4 above, and if they want even more detail, copy information from your individual project pages for risks, issues, decisions, milestones achieved or other successes, etc.
If you are ever asked to do an ad hoc status report between reporting periods, you can present using your online pages and project boards, talking through the meaning and highlights of each.
And with that…
Enjoy your stress-free project documentation, happy that you can put most of your time and effort into working with your teams and helping them get whatever they need, to get the real work done. Good luck and may all your projects be successful!
